A Levels Biology (9700)•9700/11/O/N/23
Explanation
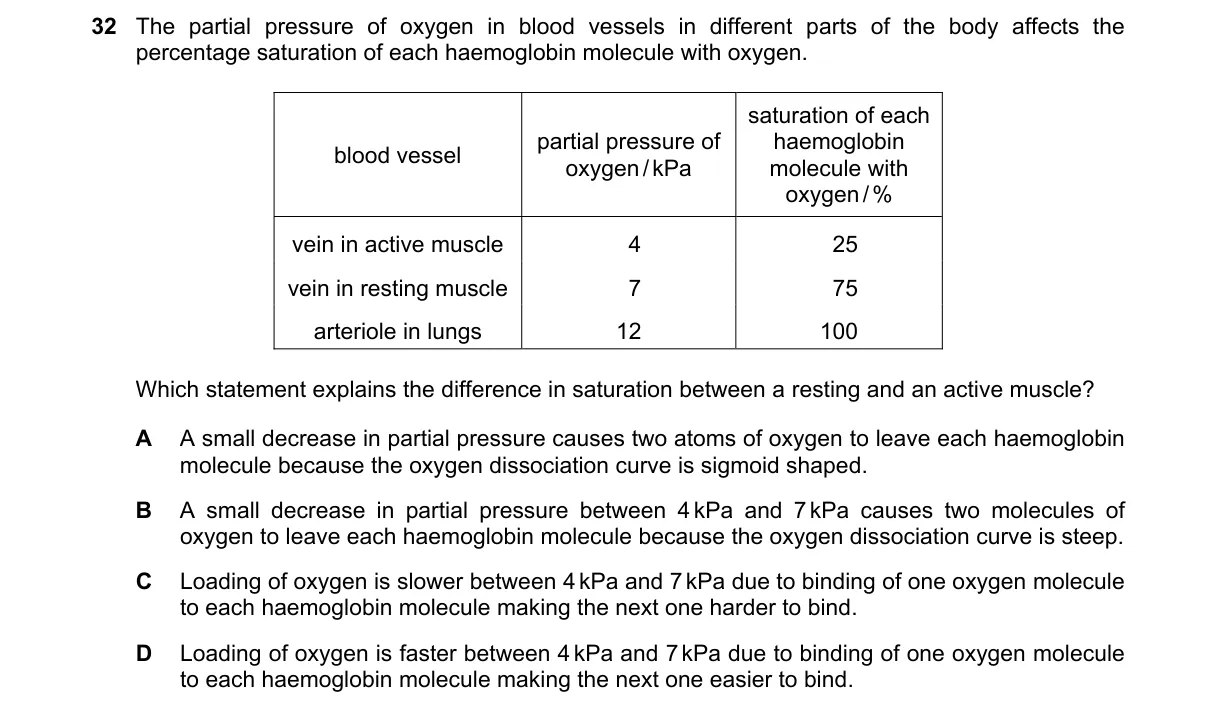
Steep portion of oxygen dissociation curve enables efficient unloading
Steps:
- Recall sigmoidal oxygen-haemoglobin dissociation curve: flat at high PO2 (lungs), steep at tissue PO2 (2-6 kPa), flat at low PO2.
- Note resting muscle PO2 ≈5.3-7 kPa (high saturation, ~90-95%), active muscle PO2 drops to ≈2.7-4 kPa (saturation falls to ~50-70%).
- In steep region (4-7 kPa), small PO2 decrease causes large saturation drop, unloading ~2 O2 per haemoglobin (Hb carries 4 total).
- This explains greater oxygen delivery to active vs. resting muscle.
Why B is correct:
- Between 4-7 kPa lies the curve's steep slope, where small ΔPO2 unloads ~2 O2/Hb per Bohr effect definition, maximizing tissue delivery.
Why the others are wrong:
- A: Omits critical 4-7 kPa range; small ΔPO2 unloads little outside steep region.
- C: Includes sigmoidal shape but ignores specific pressure range needed for ~2 O2 unloading.
- D: Incorrectly states 4 O2 unload (full saturation drop requires larger ΔPO2); range unspecified.
Final answer: B
Topic: Transport of oxygen and carbon dioxide
Practice more A Levels Biology (9700) questions on mMCQ.me