A Levels Biology (9700)•9700/11/M/J/21
Explanation
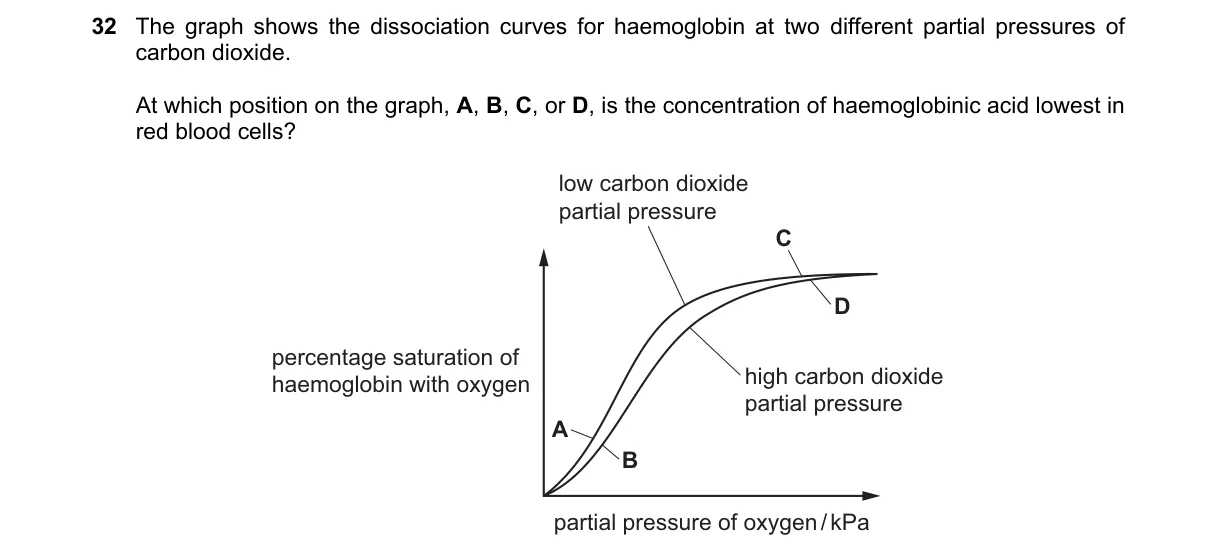
Haemoglobinic acid concentration from HbO2 dissociation curves under CO2 effect
Steps:
- Dissociation curves shift right with higher PCO2 due to Bohr effect, increasing H+ from carbonic acid and carbamino compounds.
- Haemoglobinic acid (HbH+) forms via protonation of Hb, highest where curve indicates low O2 affinity and high acidity.
- At fixed pO2, compare points A-D on curves for PCO2= low (left curve) vs high (right curve).
- Select point on high PCO2 curve showing elevated HbH+ via reduced saturation.
Why C is correct:
- C marks the point on the high PCO2 curve where protonation is maximal, per Bohr effect definition linking CO2 to Hb acidification.
Why the others are wrong:
- A: On low PCO2 curve, indicating minimal acidification.
- B: Midpoint on low PCO2 curve, not peak HbH+.
- D: Endpoint on high PCO2 curve, but reflects deoxygenated Hb, not acid concentration.
Final answer: C
Topic: Transport of oxygen and carbon dioxide
Practice more A Levels Biology (9700) questions on mMCQ.me